
MSI Afterburner hit map reveals different RTX 5090 and RTX 4090 boost behavior

New curve editor tool records voltage and frequency activity
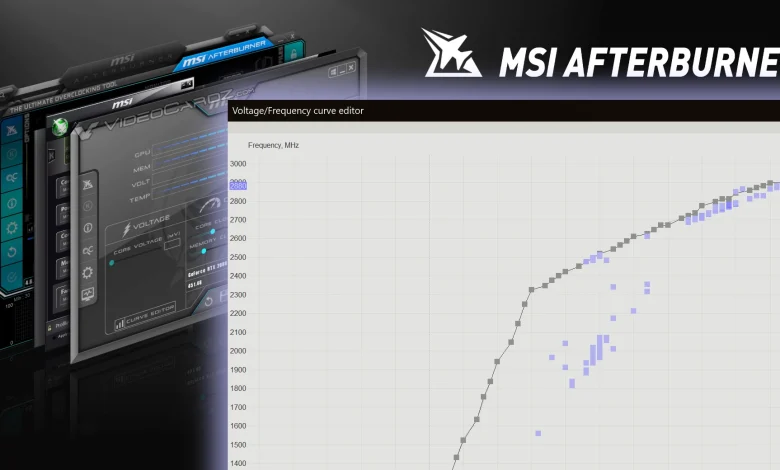
MSI Afterburner will add a voltage and frequency hit map to its V/F curve editor in the next beta. The feature records how NVIDIA GPU Boost moves across a user-defined curve while the graphics card is running different workloads.
Users can enable the hit map by pressing the M key inside the curve editor. Afterburner stores the last 256 positions reported by the current V/F point marker. These positions remain visible on the graph, with brighter yellow points representing voltage and frequency combinations used more often.
The current editor already marks the active point using crossed dotted lines. The new mode adds historical data, making it easier to identify idle voltage, common 3D operating points and the GPU-specific Vrel voltage limit. It should also help users evaluate manually edited curves and undervolting profiles.
RTX 5090 and RTX 4090 use different boost patterns
Afterburner developer Alexey “Unwinder” Nicolaychuk demonstrated the feature using GeForce RTX 5090 and RTX 4090 graphics cards. The RTX 4090 hit map remained on the defined curve between the minimum voltage and Vrel points. This matches the behavior of earlier NVIDIA architectures, which switch directly between target V/F points.

The RTX 5090 recorded additional points between the curve nodes. According to Unwinder, Blackwell uses a revised DVFS implementation that scales voltage and frequency during transitions between the current and target operating points. He says NVIDIA previously described these transitions as roughly 1,000 times faster than before.

Unwinder believes the intermediate scaling may help Blackwell GPUs reduce transient power spikes when GPU utilization changes rapidly. The hit map does not modify GPU Boost behavior, but it provides a visual record of how the algorithm responds to workloads.
MSI has not announced the release date for the next Afterburner beta.
Source: Uniko’s Hardware